
Top 15 Procurement metrics You Should Track in 2026 (With Examples and Free Excel Template)
Stop tracking useless KPIs. Discover procurement metrics that actually drive savings, efficiency & supplier performance - plus simple formulas you can use today.
Supply Chain Navigator
6/10/20268 min read
Procurement isn’t just about cutting costs anymore - it’s the engine driving resilience, risk control, and strategic value in today’s global supply chains. If you're new, start with this complete guide on what procurement in supply chain management actually means
But here’s the catch: too many organizations still cling to outdated or vanity metrics that paint a false picture of performance.
This guide cuts through the noise. With clear formulas, real‑world context, and practical insights, it highlights the procurement KPIs that truly matter—whether you’re managing suppliers in Asia, sourcing in Europe, or operating across North America. These are the metrics that reveal what’s really moving the needle in your business.
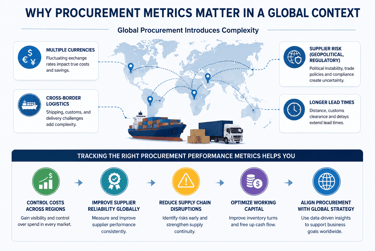
Why Procurement Metrics Matter in a Global Context?
Operating across borders isn’t just about buying from different countries - it’s about managing a web of challenges that can make or break your supply chain.
Multiple currencies mean procurement teams must constantly monitor exchange rates, hedge against volatility, and ensure accurate financial reporting across regions. A small fluctuation can wipe out cost savings if not managed carefully.
Cross‑border logistics add layers of complexity with customs clearance, varying transportation infrastructure, and compliance with international shipping regulations. Delays at one port can ripple across the entire supply chain.
Supplier risk is magnified globally—geopolitical instability, shifting regulatory landscapes, and even cultural differences can impact reliability. A strike in one country or a sudden policy change in another can disrupt critical supply lines.
Longer lead times are inevitable when goods travel thousands of miles. This requires smarter forecasting, larger safety stocks, and agile contingency planning to avoid stockouts or missed deadlines.
Tracking the right procurement KPIs isn’t just a best practice - it’s the difference between a supply chain that survives and one that thrives. The right metrics help you:
Control costs across regions by identifying inefficiencies and ensuring savings aren’t lost to hidden expenses.
Improve supplier reliability globally with data‑driven insights into performance, compliance, and risk exposure.
Reduce supply chain disruptions by spotting early warning signs and building resilience into procurement strategies.
Optimize working capital through smarter payment terms, inventory management, and cash flow alignment.
Align procurement with global strategy so that sourcing decisions directly support long‑term business goals, not just short‑term savings.
Global procurement is a balancing act between complexity and opportunity. The organizations that master performance measurement don’t just manage costs—they unlock resilience, agility, and strategic advantage across continents.

Global Procurement KPIs That Truly Matter
Procurement in a global context isn’t just about signing contracts - it’s about measuring what drives resilience, efficiency, and profitability across continents. Let’s break down the most impactful KPIs with formulas, examples, and insights that resonate with international operations.
1. Cost Savings (Global Procurement Lens)
What it Measures
Cost savings represent the reduction in spend achieved through smarter sourcing strategies (like global vs local sourcing decisions), negotiations, or supplier shifts. It’s the most visible procurement KPI, often used to demonstrate immediate financial impact. Unlike cost avoidance, which prevents expenses from rising, cost savings show tangible reductions in what the organization actually pays.
Formula
Cost Savings = (Baseline Price – New Price) × Quantity
Example
If a global supplier shift reduces cost from $12 to $10 for 50,000 units:
Savings = ($12 – $10) × 50,000 = $100,000
Why It Matters
A core procurement KPI, but must account for:
Currency fluctuations
Import duties
Logistics costs
Pro Tip
Track:
Net Savings (True Savings) = Savings – additional logistics/tariff costs
Regional Savings Performance
2. Cost Avoidance
What it Measures
Cost avoidance captures the costs prevented from rising due to proactive procurement actions. Unlike cost savings, which reduce existing spend, cost avoidance is about stopping future expenses from escalating. It’s the invisible shield that protects margins in volatile markets.
Formula
Cost Avoidance = Expected Cost – Actual Cost
Global Insight
In volatile markets like oil, metals, or freight, cost avoidance often outweighs direct savings—it’s about protecting margins before they erode.
3. Procurement Cycle Time
What it Measures
Procurement cycle time tracks the time from requisition to purchase order issuance - essentially, how long it takes for a purchase request to move through approvals and become a formal order. It’s a measure of procurement efficiency and agility, showing how quickly an organization can respond to internal demand.
Formula
Cycle Time = PO Issue Date – Requisition Date
Why It Matters Globally
Longer approval chains and time zone differences can slow procurement.
Optimization Tips
Automate workflows
Use global procurement platforms
Standardize approval hierarchies
4. Supplier Lead Time
What it Measures
Supplier lead time tracks the time between order placement and delivery - essentially, how long it takes for a supplier to fulfill an order once it’s confirmed. It’s a critical KPI because it directly impacts production schedules, inventory levels, and customer satisfaction.
Formula
Lead Time = Delivery Date – Order Date
Global Considerations
Shipping delays
Customs clearance
Port congestion
Why It Matters
Critical for direct procurement, especially in manufacturing.
5. On-Time Delivery Rate (OTD)
What it Measures
On-Time Delivery Rate (closely related to OTIF – On-Time In-Full) captures supplier reliability in meeting delivery commitments. It’s the KPI that tells you whether suppliers consistently deliver goods when promised, ensuring production schedules and customer orders stay on track.
Formula
OTD (%) = (On-Time Deliveries / Total Deliveries) × 100
Global Benchmark
World-class: 95%+
Acceptable: 85–95%
Why It Matters
Impacts production continuity across global operations.
6. Purchase Order Accuracy
What it Measures
Purchase Order (PO) accuracy reflects the accuracy of issued purchase orders - whether the details on a PO (quantities, prices, terms, supplier information, delivery dates) match the agreed contract and actual requirements. It’s a measure of precision in procurement execution, ensuring that what’s ordered aligns perfectly with what’s needed.
Formula
PO Accuracy (%) = (Accurate POs / Total POs) × 100
Why It Matters
Errors increase significantly in global procurement due to:
Currency mismatches
Incorrect Incoterms
Miscommunication
7. Supplier Defect Rate
What it Measures
Supplier defect rate evaluates the quality of supplied goods, showing how often materials or products fail to meet agreed specifications. It’s a direct reflection of supplier performance and a critical KPI for procurement teams managing global supply chains. Poor supplier quality can increase returns and impact reverse logistics processes
Formula
Defect Rate (%) = (Defective Units / Total Units Received) × 100
Global Insight
Quality variations are common when sourcing internationally.
Why It Matters
Directly impacts:
Production
Customer satisfaction
Return costs
8. Spend Under Management (SUM)
What it Measures
Spend Under Management (SUM) reflects the percentage of total spend controlled by procurement - in other words, how much of an organization’s purchasing activity flows through formal procurement processes, negotiated contracts, and approved suppliers. It’s a visibility metric that shows whether procurement is truly steering the organization’s spending or if large portions remain unmanaged. Many organizations also use ABC analysis to prioritize high-value suppliers and spend categories
Formula
SUM (%) = (Managed Spend / Total Spend) × 100
Global Benchmark
Leading organizations: 85%+
Why It Matters
Ensures procurement has visibility across regions.
9. Supplier Concentration Ratio
What it Measures
Supplier concentration ratio highlights an organization’s dependence on a small group of suppliers. It shows how much of your total spend is tied up with your top vendors, revealing whether your supply base is diversified or dangerously narrow.
Formula
Supplier Concentration = Spend with Top Suppliers / Total Spend
Why It Matters Globally
High concentration increases:
Supply risk
Geopolitical exposure
10. Contract Compliance Rate
What it Measures
Contract compliance rate tracks adherence to negotiated contracts - the percentage of spend that flows through agreed terms, preferred suppliers, and standardized conditions. In simple terms, it shows whether procurement’s hard‑won negotiations are actually being honored across the organization.
Formula
Compliance (%) = (Contract Spend / Total Spend) × 100
Why It Matters
Prevents:
Leakage of negotiated savings
Off-contract purchases
11. Maverick Spend
What it Measures
Maverick spend refers to unauthorized or off‑contract purchasing - when employees or departments bypass established procurement processes and buy directly from suppliers without approval or negotiated contracts.
Formula
Maverick Spend (%) = (Off-Contract Spend / Total Spend) × 100
Global Challenge
Decentralized teams often increase maverick spend.
12. Return on Procurement Investment (ROPI)
What it Measures
ROPI captures the value generated relative to procurement cost—essentially, how much benefit procurement delivers compared to the resources spent running the function. It’s the ROI lens applied to procurement, showing whether the team is a cost center or a true value driver.
Formula
ROPI = (Total Savings – Procurement Cost) / Procurement Cost
Why It Matters
Shows procurement’s contribution to overall profitability.
13. Supplier Risk Score
What it Measures
The supplier risk score evaluates the overall risk level associated with suppliers, capturing financial stability, geopolitical exposure, compliance, and operational reliability. It’s not just about whether a supplier can deliver—it’s about whether they can deliver consistently, ethically, and sustainably across global markets.
Factors Include:
Financial health
Political stability
ESG compliance
Supply continuity
Why It Matters Globally
Essential for managing cross-border sourcing risks.
14. Inventory Turnover Impact
What it Measures
This KPI evaluates how procurement choices affect inventory movement - closely tied to inventory management techniques and aging analysis, cash flow, and working capital efficiency. It’s not just about how much stock you hold - it’s about how quickly that stock moves through the supply chain and how procurement decisions either accelerate or slow that flow. Techniques like EOQ (Economic Order Quantity) also play a key role in optimizing procurement decisions.
Formula
Inventory Turnover = Cost of Goods Sold / Average Inventory
Global Insight
Longer supply chains = higher inventory holding risks.
15. Procurement Cost per Purchase Order
What it Measures
This KPI tracks the operational efficiency of procurement, specifically the cost incurred to process each purchase order (PO). It includes labor, system overhead, approvals, and administrative effort.
Formula
Cost per PO = Total Procurement Cost / Number of POs
Why It Matters
Automation can significantly reduce this metric globally.
If you're also managing warehouse operations, check out this complete warehouse KPI guide with dashboard examples.
Direct Procurement vs Indirect Procurement (Global View)
Understanding the difference between direct procurement and indirect procurement metrics is crucial for building a balanced procurement strategy.

Now that you know which procurement metrics matter, the next step is actually tracking them consistently.
👉 Download the free Procurement KPI Excel template to track cost savings, cycle time, OTD, and more in one place.
Common Pitfalls in Global Procurement Metrics
Global procurement metrics are powerful tools - but only if they’re tracked and interpreted correctly. Many organizations fall into recurring traps that undermine decision‑making and distort performance measurement.
1. Overlooking Total Cost of Ownership
Lowest price does not equal lowest cost. Procurement teams that chase headline savings often ignore hidden expenses like freight, tariffs, customs clearance, warranty support, and lifecycle maintenance. A supplier offering the cheapest unit price may end up costing more once these factors are included.
Insight: Always evaluate the total landed cost and long‑term ownership expenses, not just the initial purchase price.
2.Ignoring Currency Fluctuations
Exchange rates can erode negotiated savings overnight. A contract priced in a volatile currency may look attractive initially but deliver losses once converted.
Insight: Hedge against currency risks or negotiate contracts in stable currencies to preserve true savings.
3.Assuming Regional Uniformity
What works in one region may fail in another. Supplier reliability, logistics infrastructure, regulatory requirements, and cultural practices vary widely across geographies. Applying a one‑size‑fits‑all metric framework ignores these nuances.
Insight: Tailor KPIs to regional realities while maintaining global alignment.
4.Tracking Too Many KPIs
More metrics don’t mean better insights. Overloading dashboards with dozens of KPIs dilutes focus and confuses stakeholders. The result: procurement teams spend more time reporting than improving.
Insight: Prioritize a handful of high‑impact metrics—like cost savings, supplier risk, and on‑time delivery—that directly influence global strategy.
Tools for Tracking Procurement Metrics Globally
ERP systems (SAP, Oracle)
Procurement platforms (Coupa, Ariba)
Spend analytics tools
BI dashboards (Power BI, Tableau)
Final Thoughts
Global procurement success hinges on measuring what truly drives value - not vanity metrics, but KPIs that reveal resilience, efficiency, and strategic impact.
By prioritizing the right procurement metrics, organizations can:
Mitigate global supply risks through better visibility and proactive planning.
Strengthen supplier performance with data‑driven accountability and collaboration.
Achieve sustainable cost savings that go beyond short‑term price cuts.
Boost operational efficiency by streamlining processes and aligning procurement with business strategy.
The path forward doesn’t require tracking dozens of KPIs. Instead, start small: focus on a handful of high‑impact procurement metrics, refine your approach as insights grow, and then scale globally with confidence.
Frequently asked questions
1. What are procurement metrics?
Procurement metrics are measurable indicators used to evaluate the performance, efficiency, and effectiveness of procurement activities. They help organizations track cost savings, supplier performance, cycle time, and overall procurement impact on business goals.
2. What are the most important procurement KPIs?
The most important procurement KPIs include:
Cost savings
Cost avoidance
Procurement cycle time
On-time delivery (OTD)
Supplier defect rate
Spend under management
These metrics directly impact cost control, efficiency, and supplier performance.
3. How do you calculate cost savings in procurement?
Cost savings in procurement is calculated using this formula:
Cost Savings = (Old Price – New Price) × Quantity
This measures the actual reduction in spend achieved through negotiations or sourcing strategies.
4. What is the difference between direct and indirect procurement metrics?
Direct procurement metrics focus on production-related performance such as supplier lead time, quality, and on-time delivery.
Indirect procurement metrics focus on cost control, efficiency, and spend visibility for non-production purchases like services and office supplies.
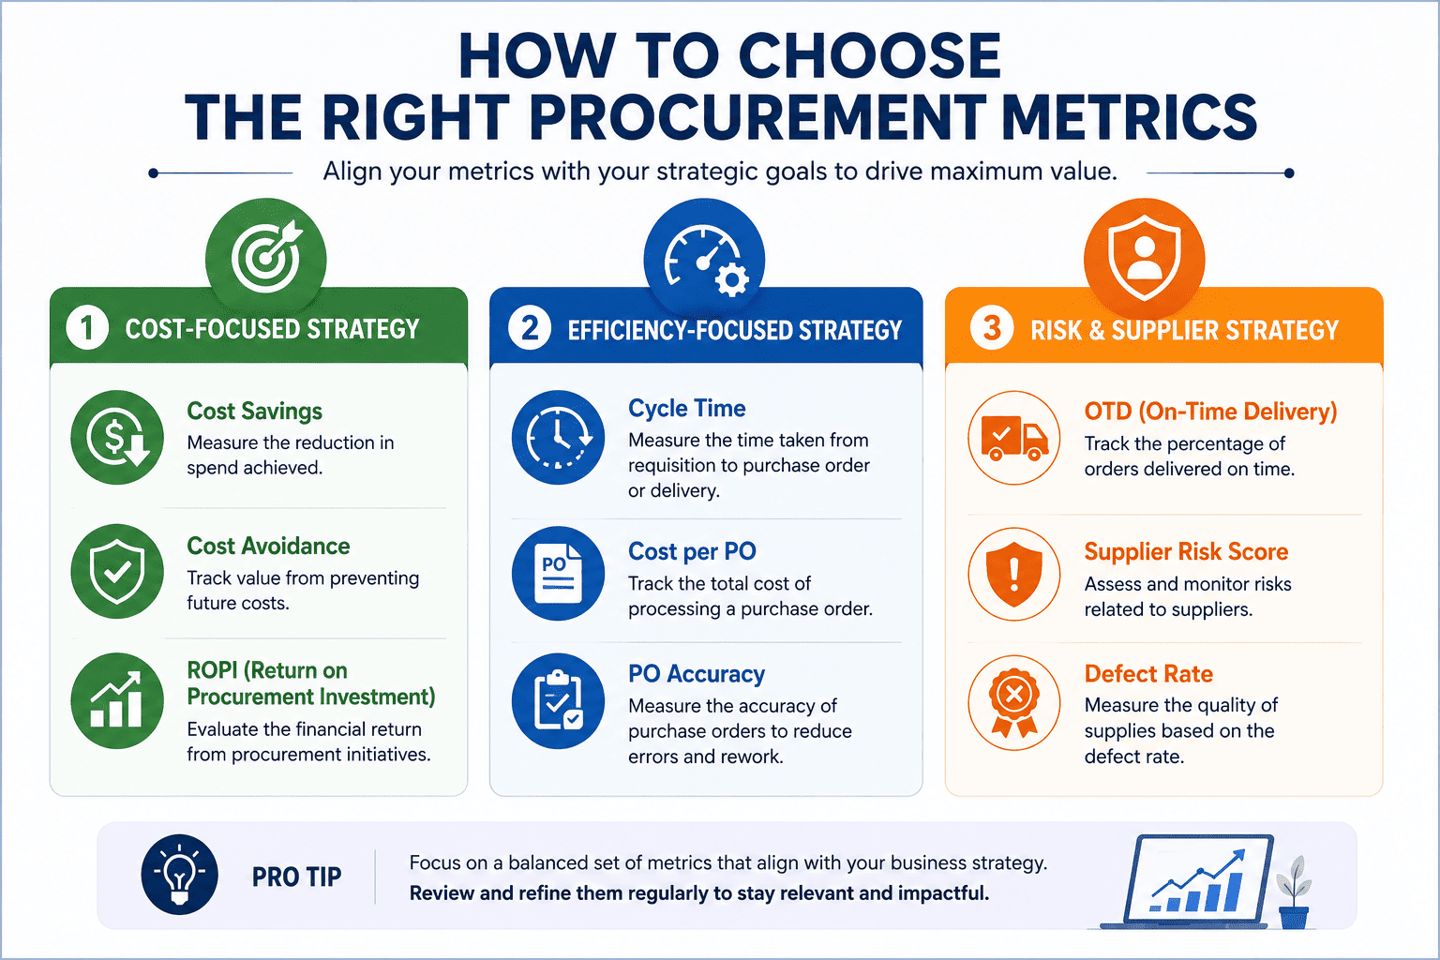
5. How do you choose the right procurement metrics?
To choose the right procurement metrics, align them with your business goals:
Use cost-focused metrics (cost savings, ROPI) for financial goals
Use efficiency metrics (cycle time, cost per PO) for process improvement
Use risk metrics (OTD, defect rate) for supplier performance
Focus on a small set of high-impact KPIs rather than tracking too many.