
Inventory Aging Report (2026): Free Template + Real Examples + Excel Guide
Stop dead stock from draining your cash. Learn how to create an inventory aging report with a free template, real examples, and proven strategies that work.
Supply Chain Navigator
5/28/20269 min read
What is an Inventory Aging Report?
An Inventory Aging Report is a financial and operational report that categorizes inventory based on how long it has been in stock. Instead of just showing what you have, it shows how long you’ve had it. To manage stock efficiently, businesses must also follow proven inventory management techniques that complement aging analysis.
Typically, inventory is grouped into aging buckets such as:
0–30 days (fresh inventory)
31–60 days
61–90 days
91–180 days
180+ days (slow-moving or dead stock)
This report helps businesses quickly identify:
Slow-moving items
Obsolete inventory
Excess stock
Working capital tied up in inventory
Why Inventory Aging is Critical (Real Example)
Consider a company with:
Inventory value: $750,000
Dead stock (>180 days): $200,000
Holding cost: 18% annually
👉 Annual loss from dead stock = $36,000. That’s pure cash drain—no revenue, no movement.
Globally, businesses lose 10–30% of inventory value annually due to poor inventory management. One of the key indicators behind this loss is a poor inventory turnover ratio, which directly correlates with aging stock.
Key Components of an Inventory Aging Report
A well-structured aging report doesn’t just list items — it tells the story of how your stock is moving, where risks lie, and where opportunities exist. Let’s break down the essential elements:
1. SKU / Item Details
Item Code: A unique identifier that ensures accuracy in tracking.
Description: A short but clear explanation of the product.
Category: Groups items into logical segments (e.g., raw materials, finished goods, spare parts). 👉 This section provides the foundation for analysis, helping managers quickly identify which items are being reviewed.
2. Quantity on Hand
Shows how many units are physically available in stock.
Critical for understanding whether inventory levels align with demand. 👉 Large quantities of slow-moving items can signal overstocking, while low quantities of fast-moving items may highlight replenishment needs. These metrics are often tracked as part of broader warehouse KPI metrics used to measure operational efficiency.
3. Inventory Value
Calculated using the cost price of items.
Provides a financial perspective on how much capital is tied up in inventory. 👉 This helps businesses assess the monetary impact of aging stock and prioritize liquidation or discount strategies.
4. Last Movement Date
Records the most recent transaction: sale, usage, or transfer.
Acts as a timestamp for activity, showing whether an item is active or dormant. 👉 Items with very old movement dates are red flags for obsolescence and potential write-offs.
5. Aging Buckets
Categorizes items based on how long they’ve been in inventory (e.g., 0–30 days, 31–60 days, 61–90 days, 90+ days).
Provides a structured view of stock longevity. 👉 This segmentation makes it easier to spot trends — for example, items consistently stuck in the 90+ day bucket may need promotional push or disposal.
6. Total Value by Bucket
Summarizes the financial exposure in each aging category.
Helps managers see not just the count of items, but the value at risk. 👉 For instance, if most of your high-value items sit in older buckets, it signals a bigger financial concern than just excess low-value stock.
Inventory Aging Report Template
Here’s a simple but powerful template you can use in Excel or Google Sheets:
Download the exact template used in this guide 👇
How to Create an Inventory Aging Report
An inventory aging report isn’t just another spreadsheet—it’s a powerful lens into how your stock is performing over time. Think of it as a health check for your warehouse. Here’s how you can build one step by step:
1. Gather Data
Start with the basics. Pull together the key details for each item:
SKU / Item Code – the unique identifier.
Quantity – how many units are sitting in stock.
Cost – the purchase or production cost per unit.
Last Movement Date – when the item was last sold, used, or transferred.
👉 This raw data is the backbone of your report. Without it, you’re just guessing.
2. Calculate Days in Inventory
Now, measure how long each item has been hanging around. Formula:
Days in Inventory=Today’s Date−Last Movement Date
👉 This simple calculation reveals whether items are fresh movers or gathering dust.
3. Assign Aging Buckets
Next, group items into time brackets. Common buckets include:
0–30 days
31–60 days
61–90 days
90+ days
👉 These categories make patterns visible. For example, if too many items fall into the 90+ day bucket, you may be sitting on dead stock.
4. Analyze Value by Bucket
Here’s where the magic happens. Use pivot tables or dashboards to break down:
% of aging inventory – what share of stock is stuck in older buckets.
Total dead stock value – the financial weight of items unlikely to move.
👉 This step transforms your report from a list of numbers into actionable insights. You’ll see not just how much inventory is aging, but how much money is tied up in it.
Real-World Example: Retail Business
A global apparel retailer runs an aging report and finds:
When the inventory report came in, the numbers told a clear story. Out of a total stock valued at $1,000,000, a significant portion—about $350,000, or 35%—was classified as dead or slow‑moving, sitting idle for more than 90 days. That’s more than just a statistic; it’s a signal that cash flow is being tied up in products that aren’t generating returns.
To tackle the issue, several decisive steps were taken. Items that had been stuck for over 180 days were pushed into a clearance sale with a 40% discount, giving them a chance to move out quickly and free up space. At the same time, slow‑moving products were bundled with fast‑moving ones, turning them into value‑adds rather than liabilities. On the procurement side, supplier orders were reduced by 25%, ensuring that fresh inflows of stock didn’t worsen the problem.
The impact was tangible. Within just three months, the company managed to cut down dead stock by $120,000, a significant recovery that not only reduced waste but also improved cash flow. What started as a red flag in the aging report became an opportunity to rethink stocking strategies, align purchases more closely with demand, and keep the warehouse leaner and more efficient.
Industry-Specific Benchmarks
Inventory aging isn’t a one‑size‑fits‑all metric—it varies widely depending on the industry. For example, in retail and e‑commerce, a healthy benchmark is keeping less than 20% of stock beyond 90 days. Once that figure creeps above 30%, it signals a risky situation where products may be tying up capital and losing relevance. Inventory strategies are also influenced by sourcing decisions such as global sourcing vs local sourcing.
In manufacturing, the picture looks different. Raw materials often age more slowly because they’re purchased in bulk and consumed over longer production cycles. Finished goods, however, should ideally move within 60 to 90 days—any longer and the company risks inefficiencies or excess storage costs.
For fast‑moving consumer goods (FMCG), the stakes are even higher. Anything sitting beyond 60 days is considered risky because expiry dates loom large. Here, aging isn’t just about financial exposure—it’s about product safety and customer trust.
The electronics industry faces another unique challenge: obsolescence. Technology evolves quickly, and stock that lingers for more than 90 days can lose value rapidly. A smartphone model or computer part that seemed current three months ago may already be outdated, forcing businesses to discount heavily or write off losses.
Taken together, these benchmarks highlight why aging reports must be tailored to the industry. What looks acceptable in manufacturing could be disastrous in FMCG, and what feels manageable in retail could spell trouble in electronics. Understanding these nuances allows businesses to set realistic targets, spot risks early, and design smarter inventory strategies that fit their sector.
Benefits of Using an Inventory Aging Report
An aging report is more than a spreadsheet; it’s a financial and operational tool. One of the biggest advantages is improved cash flow. By identifying capital tied up in slow‑moving stock, businesses can take corrective action and release funds for more productive use. Storage costs also come down—warehousing expenses often drop by 10–25% when excess inventory is cleared. Another benefit is preventing obsolescence, which is especially critical in industries like technology and fashion where products lose relevance quickly. It also strengthens demand planning, helping refine forecasting and procurement decisions. Techniques like economic order quantity (EOQ) further optimize how much inventory to hold. Finally, aging reports support financial reporting, serving as evidence in audits and valuation adjustments.
Advanced Techniques
Aging reports become more powerful when combined with ABC analysis. For example, A‑items older than 60 days should trigger immediate action, while C‑items can be allowed up to 180 days before intervention. Another useful metric is the inventory turnover ratio, calculated as Cost of Goods Sold divided by Average Inventory. Low turnover often correlates with aging stock. Modern automation tools like ERP or WMS systems can take this further by auto‑generating reports, triggering alerts for slow‑moving items, and even recommending liquidation strategies.
How to Take Action on Aging Inventory
Identifying aging inventory is only half the job—the real impact comes from taking the right action at the right time. Below are proven strategies used by global businesses to reduce dead stock and unlock cash flow.
1. Discounting Strategy
Offer targeted discounts on older stock—but do it smartly, not blindly.
Use tiered discounting:
60–90 days → 10–20% discount
90–180 days → 20–40% discount
180+ days → 40–70% clearance
Run limited-time offers to create urgency
Use channel-specific discounts (online vs retail)
Protect margins by avoiding discounts on fast-moving SKUs
👉 Example: A retailer reduced $80,000 worth of 120-day-old stock by offering a “Buy 2 Get 1 Free” campaign instead of flat discounting—resulting in higher volume movement.
2. Bundling
Combine slow-moving items with high-demand products to increase sell-through.
Bundle complementary products (e.g., mouse + keyboard)
Use anchor products (fast sellers) to drive bundle sales
Offer bundles at a slight perceived discount (not deep cuts)
Promote bundles as value deals, not clearance
👉 Example: An electronics store bundled slow-moving headphones with best-selling smartphones and cleared 70% of aging stock in 6 weeks.
3. Return to Supplier
Recover value by negotiating with suppliers—often overlooked but powerful.
Include return clauses in contracts upfront
Negotiate partial returns or credit notes
Offer to exchange for fast-moving SKUs
Build long-term supplier relationships to enable flexibility
Suppliers are more open to returns if you:
Commit to future orders
Share sales data transparently
4. Liquidation
When inventory becomes non-strategic, liquidation is the fastest way to free up cash.
Sell through:
Wholesalers
Discount marketplaces
B2B liquidation platforms
Accept lower margins to recover working capital quickly
Use liquidation for:
Obsolete products
Seasonal leftovers
Excess bulk inventory
👉 Example: A fashion brand liquidated $150,000 of last-season inventory at 30% recovery value, but freed up warehouse space and reinvested in new collections—resulting in higher ROI overall.
5. Repurposing
Turn aging inventory into something new instead of writing it off.
Repackage products (new branding, combo packs)
Convert raw materials into alternative SKUs
Use items for:
Samples
Promotional giveaways
Internal use
Sell in different markets or regions where demand exists
👉 Example: A food company repackaged near-expiry bulk stock into smaller discount packs, increasing sell-through by 50%.
Best Strategy: Combine Multiple Actions
The most effective companies don’t rely on just one approach.
They use a hybrid strategy:
Discount (short-term push)
Bundle (increase perceived value)
Liquidate (last resort)
👉 This layered approach can reduce aging inventory by 30–60% within a quarter.
Common Mistake to Avoid
Don’t wait too long. The longer inventory sits:
The deeper discounts required
The lower recovery value
The higher holding cost
👉 Action window:
60 days → Monitor
90 days → Act
180 days → Exit
Inventory Aging Report Dashboard (What to Track)
Here’s what a modern inventory aging dashboard looks like:

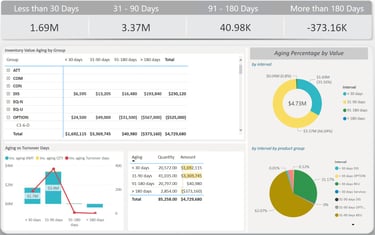
A strong dashboard should include:
% inventory in each aging bucket
Total value of dead stock
Top 10 slow-moving SKUs
Aging trend over time
Inventory turnover ratio
These metrics are typically visualized in a warehouse KPI dashboard for real-time tracking.
Final Thoughts
An Inventory Aging Report is not just a spreadsheet—it’s a strategic tool. Businesses that actively monitor and act on aging inventory can:
Unlock significant working capital
Improve profitability
Reduce operational inefficiencies
In a world where supply chains are becoming more complex and competitive, ignoring inventory aging is simply too costly. If you’re not already using an aging report, start with the template above and refine it as your business grows.
Because in inventory management, time is money—and aging inventory is money slipping away.
Bonus: Quick Checklist
✔ Do you track inventory aging regularly?
✔ Do you have defined aging buckets?
✔ Do you act on slow-moving inventory?
✔ Do you integrate aging data with demand planning?
If not, now is the time to start.
Want to take it further? Build a dashboard and automate alerts—you’ll move from reactive to proactive inventory management.
Frequently asked questions
What is an inventory aging report?
An inventory aging report is a tool that categorizes stock based on how long it has been held in inventory. It helps businesses identify slow-moving, excess, or obsolete stock so they can take corrective actions and improve cash flow.
How do you calculate inventory aging?
Days in Inventory = Current Date – Last Movement Date
Based on the number of days, inventory is categorized into aging buckets like 0–30 days, 31–60 days, and so on.
What is considered slow-moving or dead stock?
Slow-moving inventory: Items that haven’t moved for 60–90 days
Dead stock: Items unsold for more than 180 days
However, this varies by industry (e.g., FMCG vs manufacturing).
How often should inventory aging reports be reviewed?
Fast-moving industries (e-commerce, retail): Weekly
Manufacturing or B2B: Monthly
Regular reviews help businesses act early and avoid heavy losses.
What is a good inventory aging benchmark?
A healthy inventory profile typically has:
Less than 20–25% inventory older than 90 days
Minimal stock beyond 180 days
Higher percentages indicate inefficiencies in inventory management.